Research Highlights
Research Highlights
A selection of highlights culled from publications by HAO staff.
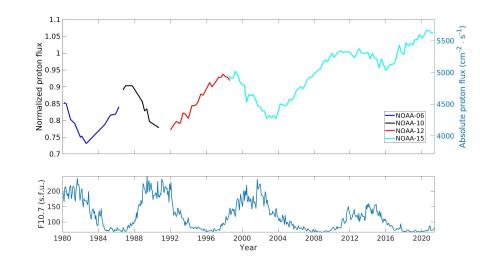
Gleissberg Cycle Dependence of Inner Zone Proton Flux
Authors E. J. Bregou, M. K. Hudson, B. T. Kress, M. Qin, and R. S. Selesnick find a long-term increase in measured proton flux over four ~11 year cycles of solar activity. The inner zone proton radiation belt consisting of 10’s to >100 MeV protons trapped in the Earth’s magnetic field is examined from 1980 to mid-2021 using measurements from four NOAA POES satellites.
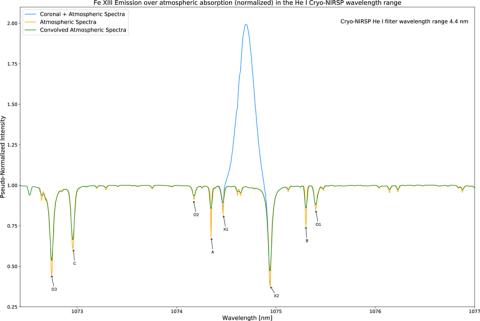
A Spectroscopic Survey of Infrared 1–4 μm Spectra in Regions of Prominent Solar Coronal Emission Lines of Fe XIII, Si X, and Si IX
Authors Aatiya Ali, Alin Razvan Paraschiv, Kevin Reardon, and Philip Judge, assert that the infrared solar spectrum contains a wealth of physical data about the Sun and is being explored using modern detectors and technology with new ground-based solar telescopes. One such instrument will be the ground-based Cryogenic Near-IR Spectro-Polarimeter of the Daniel K. Inouye Solar Telescope.
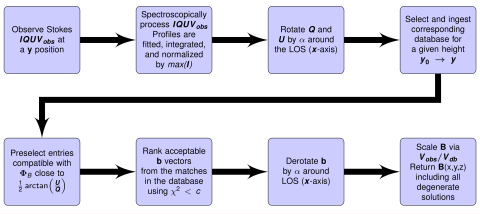
Efficient and Automated Inversions of Magnetically-Sensitive Forbidden Coronal Lines: CLEDB - The Coronal Line Emission DataBase Magnetic Field Inversion Algorithm
Alin Paraschiv and Philip Judge present CLEDB, a single point inversion algorithm for determining magnetic parameters using spectro-polarimetric measurements of emission lines formed in the solar corona.
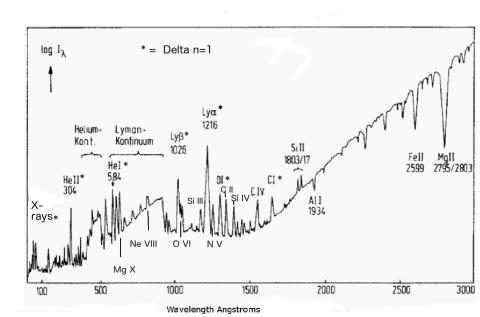
Optimal spectral lines for measuring chromospheric magnetic fields
This paper identifies spectral lines from EUV to infrared wavelengths which are optimally suited to measuring vector magnetic fields as high as possible in the solar atmosphere.
The Coronal Veil
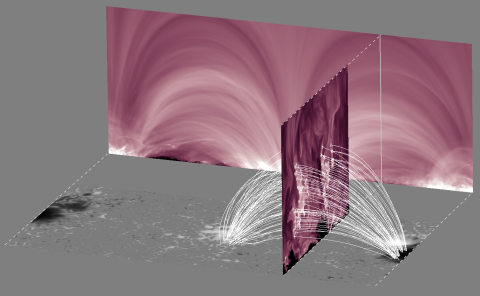
Coronal loops, seen in solar coronal images, are believed to represent emission from magnetic flux tubes with compact cross sections. Anna Malanushenko, Matthias Rempel and others, examine the 3D structure of plasma above an active region in a radiative magnetohydrodynamic simulation to locate volume counterparts for coronal loops.

Effects of spectral resolution on simple magnetic field diagnostics of the Mg II h & k lines
Rebecca Centeno, Matthias Rempel, Roberto Casini, and Tanausu del Pino Aleman study the effects of finite spectral resolution on the magnetic field values retrieved through the weak field approximation (WFA) from the cores of the Mg II h&k lines.
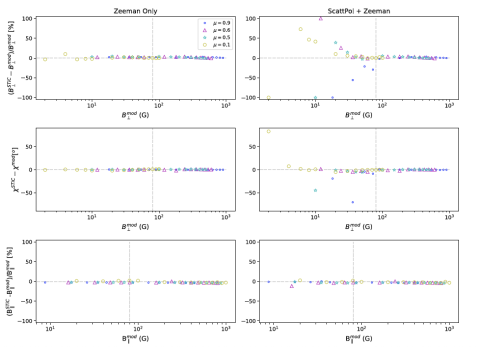
On the (Mis)interpretation of the Scattering Polarization Signatures In the Ca II 8542 A line Through Spectral Line Inversions
Scattering polarization tends to dominate the linear polarization signals of the Ca II 8542 A line in weakly magnetized areas, especially when the observing geometry is close to the limb. In this paper we evaluate the degree of applicability of existing non-LTE spectral line inversion codes at inferring the magnetic field vector and, particularly, its transverse component.
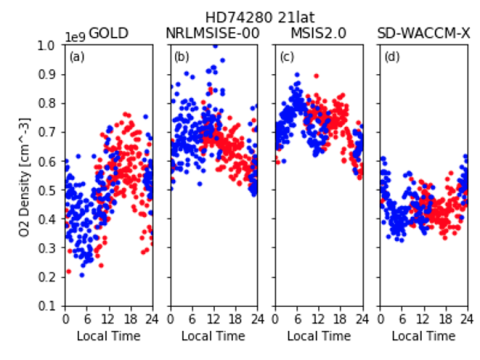
The Molecular Oxygen Density Structure of the Lower Thermosphere as Seen by GOLD and Models
This paper compares new observations from the Global-scale Observations of Limb and Disk (GOLD) mission of molecular oxygen (O2) in the lower thermosphere (130 - 200 km in altitude) to widely used models in the aeronomy community.
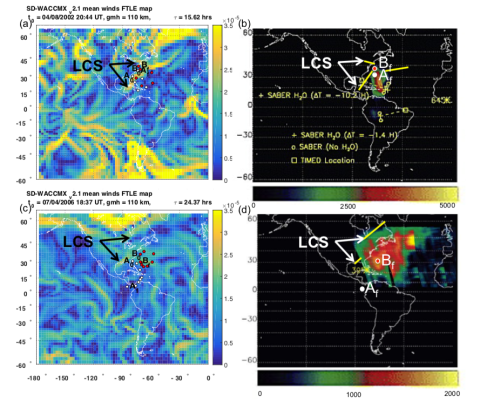
Lower thermospheric material transport via Lagrangian coherent structures
Lagrangian coherent structures (LCSs), indicating regions of material transport, are derived from models of the lower thermosphere for five space shuttle water vapor plume events. LCSs defined using flow fields from the Specified Dynamics version of the Whole Atmosphere Community Climate Model with thermosphere eXtension (SD-WACCMX) are compared to global ultraviolet imager (GUVI) observations of water vapor documented in the literature.